Diagnose Performance Issues in .NET Core Application | Elastic Beanstalk | Exam DVA-C01
Question
You are developing a .Net Core application that is going to be hosted in an Elastic beanstalk environment.
The application is going to make backend calls to a database.
You need to increase the performance of the application during the testing phase.
How can you diagnose any performance issues in the easiest way possible?
Answers
Explanations
Click on the arrows to vote for the correct answer
A. B. C. D.Answer - C.
The best way is to use the X-Ray service which can be used to automatically see the call trace and time spend in each layer.
The below snapshot from the AWS Documentation showcases this.
AWS X-Ray is a service that collects data about requests that your application serves.
X-Ray provides tools you can use to view, filter, and gain insights into that data to identify issues and opportunities for optimization.
For any traced request to your application, you can see detailed information in the AWS X-Ray console.
This includes information not only about the request and response, but also about calls that your application makes to downstream AWS resources, microservices, databases, and HTTP web APIs.
Option A is incorrect since this will not help you diagnose ways to improve your application's performance.
Option B is partially correct.
You can do this, but the easiest way is to use the X-Ray service.
Option D is incorrect since the logs will not give detailed time tracing of the calls of your application.
For more information on an example on this, please refer to the below URL-
https://aws.amazon.com/blogs/developer/new-aws-x-ray-net-core-support/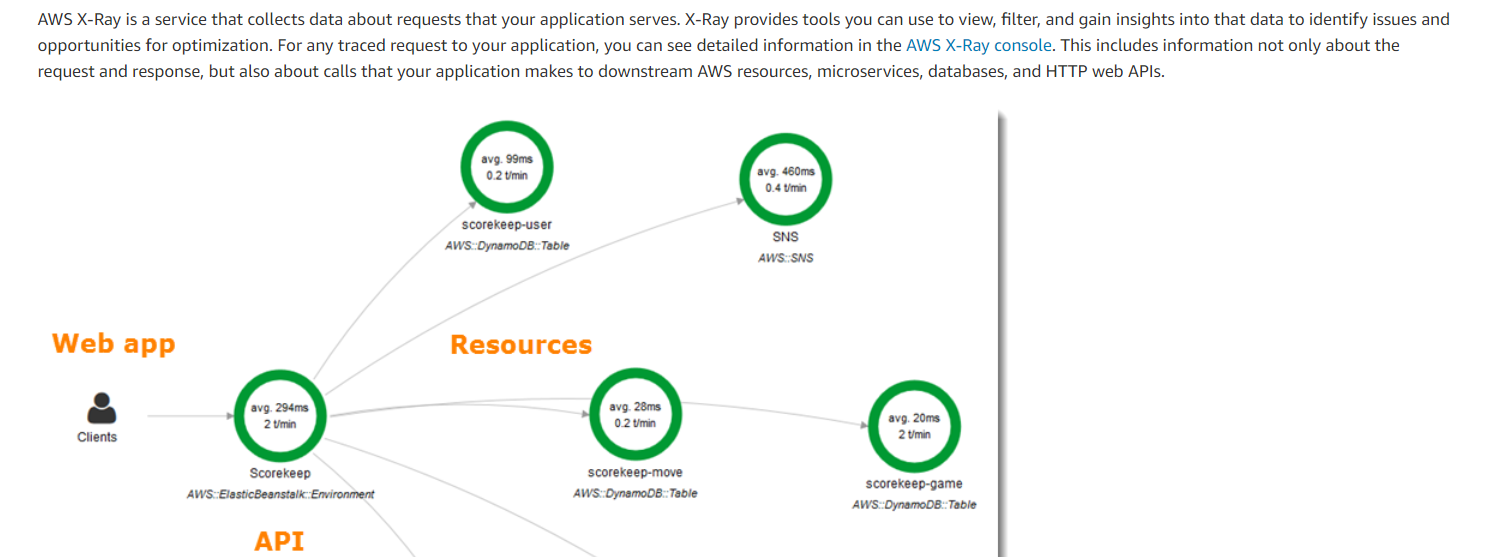
The best way to diagnose performance issues in a .Net Core application that is going to be hosted in an Elastic Beanstalk environment is to make use of traces using the X-Ray service (Option C).
AWS X-Ray is a service that allows developers to trace requests made to their applications and identify performance bottlenecks. By using X-Ray, you can gain visibility into how your application is performing and identify any areas that need optimization.
X-Ray supports .NET Core applications, and you can easily integrate it into your application by installing the AWS X-Ray SDK for .NET. Once installed, you can use the SDK to add trace information to your application's requests and responses. This trace information is then sent to X-Ray, where you can view it in the AWS Management Console.
With X-Ray, you can see the time taken by each component of your application, such as the time taken to make a database call or process a request. You can also see how requests are flowing through your application and identify any issues that are causing delays or bottlenecks.
Therefore, option C is the best choice for diagnosing performance issues in a .Net Core application hosted in an Elastic Beanstalk environment. Option B (placing instrumentation calls in your code) can also help, but it requires more manual work and can be less effective than using X-Ray. Option A (placing a load balancer in front of Elastic Beanstalk) and option D (using CloudWatch logs to debug issues) are not directly related to diagnosing performance issues, although they may be useful in other aspects of application development and management.