Get Current Memory Usage and Allocate Resources for Your Lambda Function
Question
You create a Lambda Function to process clients' queries from a web application.
The workload is time sensitive so that you want the Lambda function to finish processing and respond as quickly as possible.
You prefer allocating more resources such as memories or CPUs to the Lambda Function.
However, you are unsure how many resources are being used at the moment.
Which action can help you to get the current memory usage and allocate more resources if needed?
Answers
Explanations
Click on the arrows to vote for the correct answer
A. B. C. D.Correct Answer - B.
Check https://docs.aws.amazon.com/lambda/latest/dg/resource-model.html on how to configure Lambda Functions.
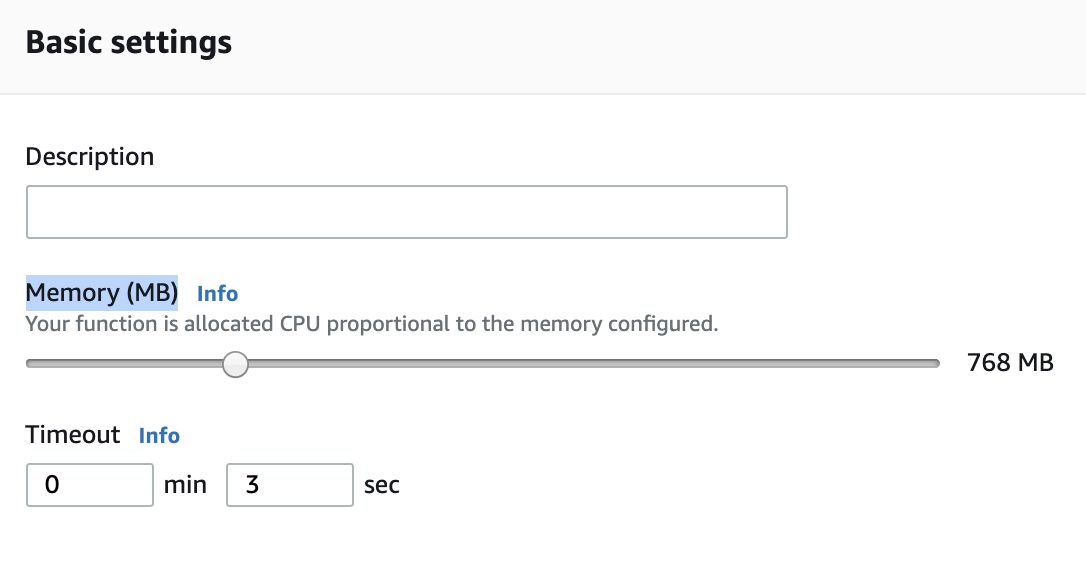
Users can allocate memories for a Lambda Function as below:
Option A is incorrect: We cannot use the default CloudWatch metrics to get the allocated and used memory.
Option B is CORRECT: We can get the max memory used from the CloudWatch logs.
If the max memory used is close to the memory allocated, it is better to allocate more memories to speed up the processing.
Option C is incorrect: Because the reserved concurrency does not influence how many memories or CPUs the Lambda Function has to process a request.
Option D is incorrect: Although Lambda Function is serverless, users are still responsible for monitoring the running status and allocating more resources if needed.
The correct answer is B. Check CloudWatch Logs to get the max memory used and allocate more memory if needed.
Explanation:
When you create a Lambda Function, you specify the amount of memory and CPU allocated to it. The more memory and CPU you allocate, the faster the function will execute. However, if you allocate too much memory, you will waste resources and pay more than necessary. On the other hand, if you allocate too little memory, the function may run slowly or not at all.
To optimize the performance of your Lambda Function, you need to monitor its resource usage and adjust the allocation as needed. One way to do this is by checking the CloudWatch Logs for your function.
The CloudWatch Logs for a Lambda Function include a log stream for each invocation of the function. Each log stream includes a log message that shows the amount of memory and CPU allocated to the function and the amount of memory used during the invocation.
By analyzing the CloudWatch Logs, you can determine the maximum amount of memory used by your function and adjust the memory allocation accordingly. If you find that your function frequently runs out of memory, you can increase the memory allocation to improve its performance.
Checking the default CloudWatch metrics (Answer A) can provide some information about the allocated and used memories, but it won't give you the detailed information needed to optimize the performance of your function. Similarly, checking the max number of invocations (Answer C) won't tell you anything about the resource usage of your function.
Answer D is incorrect because while Lambda Function resources can auto-scale, it is still up to the user to determine the initial amount of resources to allocate and monitor their usage to optimize performance.