Configuring the Elapsed Time Chart Widget for Azure DevOps
Question
You are configuring project metrics for dashboards in Azure DevOps.
You need to configure a chart widget that measures the elapsed time to complete work items once they become active.
Which of the following is the widget you should use?
Answers
Explanations
Click on the arrows to vote for the correct answer
A. B. C. D.C
Cycle time measures the time it takes for your team to complete work items once they begin actively working on them.
https://docs.microsoft.com/en-us/azure/devops/report/dashboards/cycle-time-and-lead-time?view=vsts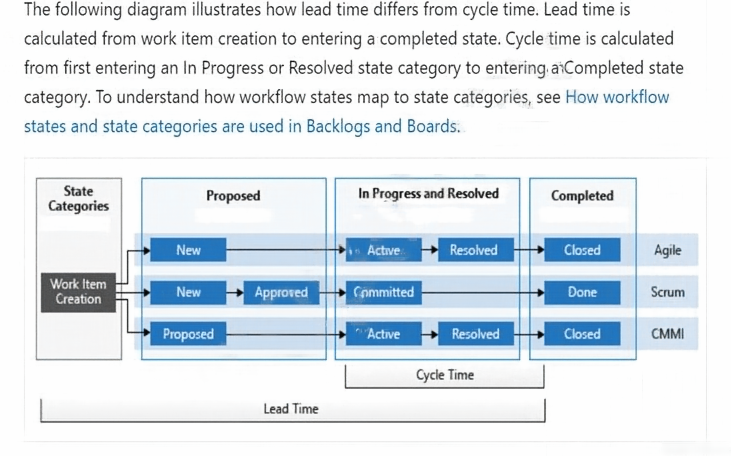
The widget that should be used to measure the elapsed time to complete work items once they become active is Cycle time.
Cycle time is the duration between the moment when a work item is moved to the 'In Progress' state and the moment it is moved to the 'Done' state. Cycle time is a measure of the time it takes for a work item to be completed, and is used to help identify bottlenecks in the development process, as well as to identify opportunities for process improvements.
Cumulative Flow Diagrams, Burnups, and Burndowns are other chart widgets that can be used to measure project metrics, but they do not specifically measure the elapsed time to complete work items once they become active.
Cumulative Flow Diagrams track the number of work items in each state over time, and can help identify bottlenecks in the development process.
Burnups track progress toward completing a set of work items, and can help predict when the work will be completed.
Burndowns track remaining work over time, and can help identify whether a team is on track to complete the work within a given timeframe.
In summary, Cycle time is the widget that should be used to measure the elapsed time to complete work items once they become active, and it can be used to identify bottlenecks and opportunities for process improvements.
