Question 31 of 296 from exam AZ-400: Designing and Implementing Microsoft DevOps Solutions
Question
DRAG DROP -
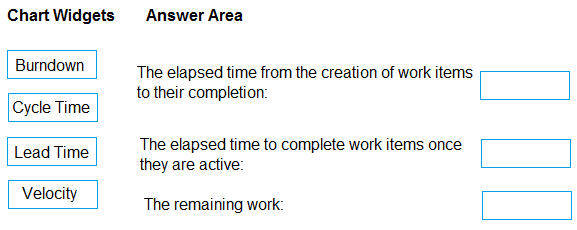
You need to recommend project metrics for dashboards in Azure DevOps.
Which chart widgets should you recommend for each metric? To answer, drag the appropriate chart widgets to the correct metrics. Each chart widget may be used once, more than once, or not at all. You may need to drag the split bar between panes or scroll to view content.
NOTE: Each correct selection is worth one point.
Select and Place:
Explanations
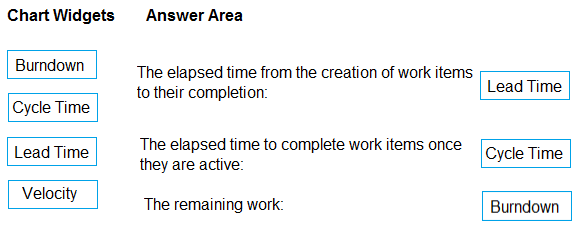
Box 1: Lead time -
Lead time measures the total time elapsed from the creation of work items to their completion.
Box 2: Cycle time -
Cycle time measures the time it takes for your team to complete work items once they begin actively working on them.
Box 3: Burndown -
Burndown charts focus on remaining work within a specific time period.
Incorrect Answers:
Velocity provides a useful metric for these activities:
Support sprint planning -
Forecast future sprints and the backlog items that can be completed
A guide for determining how well the team estimates and meets their planned commitments
https://docs.microsoft.com/en-us/azure/devops/report/dashboards/velocity-guidance?view=vsts https://docs.microsoft.com/en-us/azure/devops/report/dashboards/cycle-time-and-lead-time?view=vsts https://docs.microsoft.com/en-us/azure/devops/report/dashboards/configure-burndown-burnup-widgets?view=vsts